


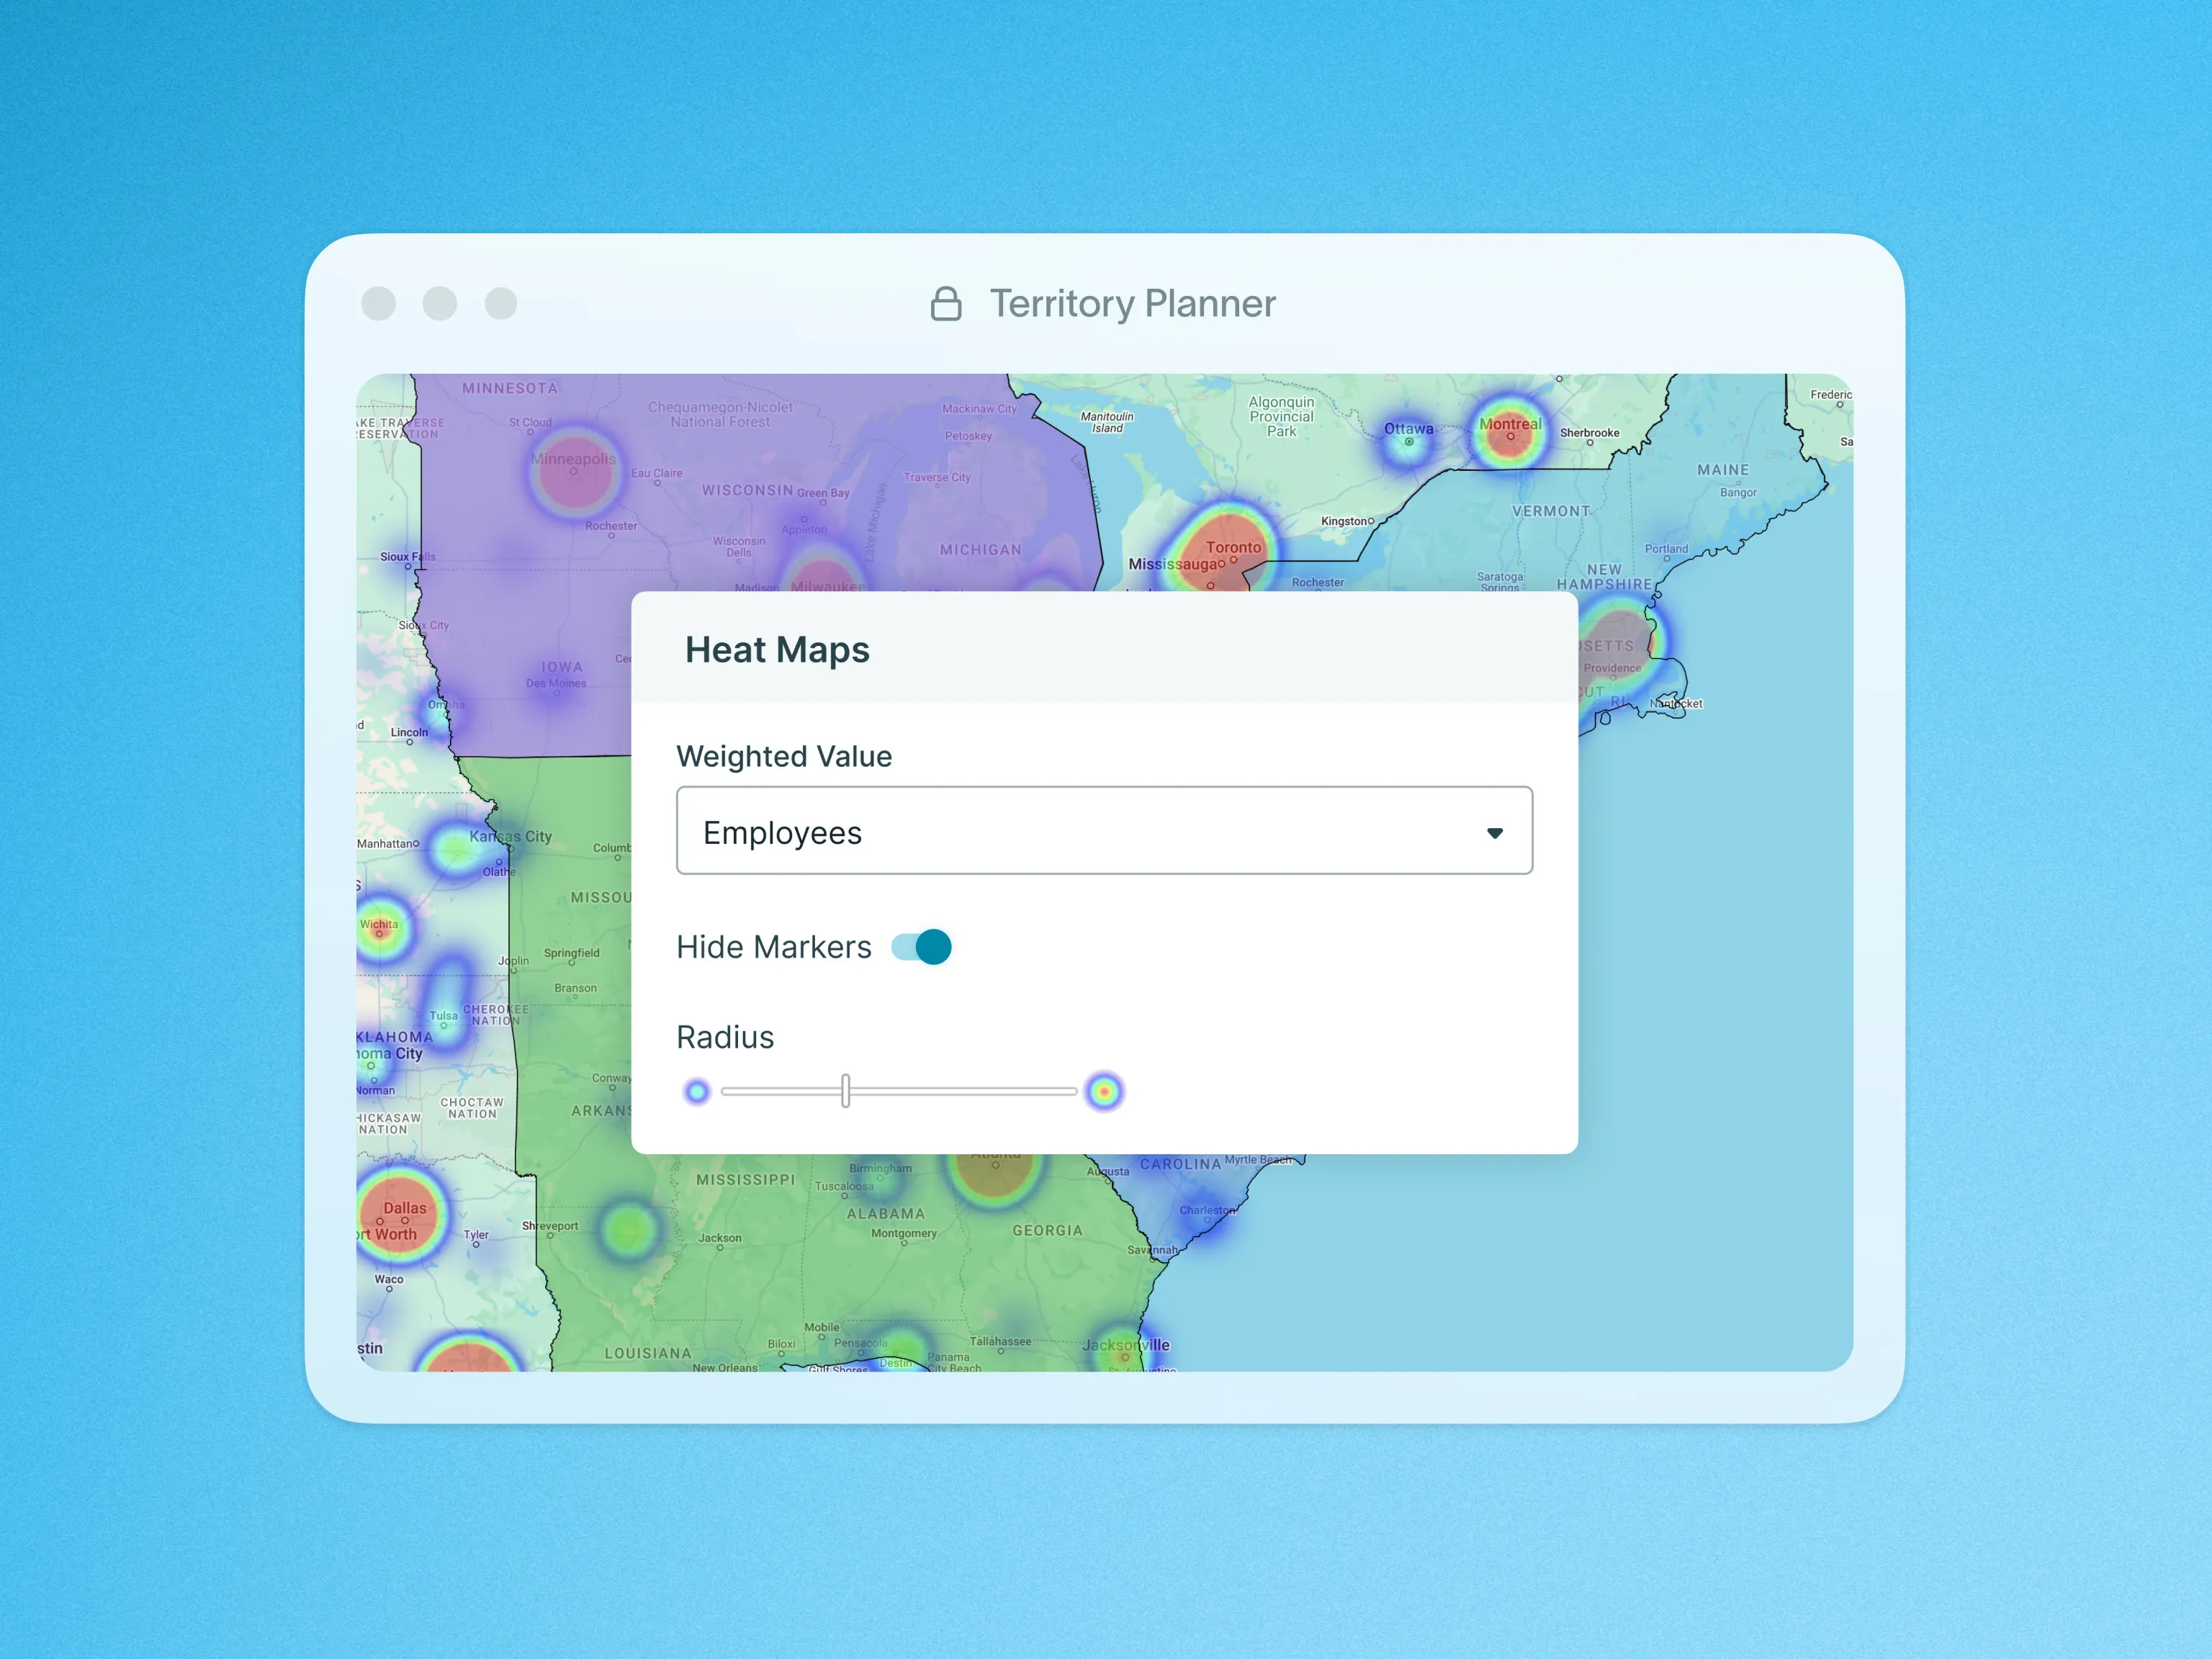
Heat Maps
Transform location data into heat maps to spot patterns, hotspots, and coverage gaps fast.
Oops! Something went wrong while submitting the form.
Visualize Trends That Matter
Transform raw location data into powerful, easy-to-understand insights with customizable heat maps. This feature allows you to identify patterns and concentrations at a glance—right on the map.
How It Works:
- A dedicated Heat Map panel has been added to the Control Panel, giving you full control over weighted fields, normalization, radius, and visibility.
- Configure your heat map directly within the Heat Map tab—set your parameters and instantly see the results.
- Dynamic updates allow heat maps to respond in real-time to your selected configurations, with smart default settings to help you get started fast.
Why You’ll Love It:
- Reveal hidden trends and hotspots with impactful, color-coded visualizations.
- Customize your analysis to focus on the metrics and fields that matter most to your business.
- Work confidently with intuitive controls designed for users of all skill levels.
To learn more about Heat Maps, visit our help site.

Features